
In this personal project (December 2024), I explore how A/B testing can drive product decisions. Using test data from a B2C company like AllTrails, I examine how a small feature change in the user interface can influence engagement, retention, and conversion, and propose actionable next steps for further investigation.
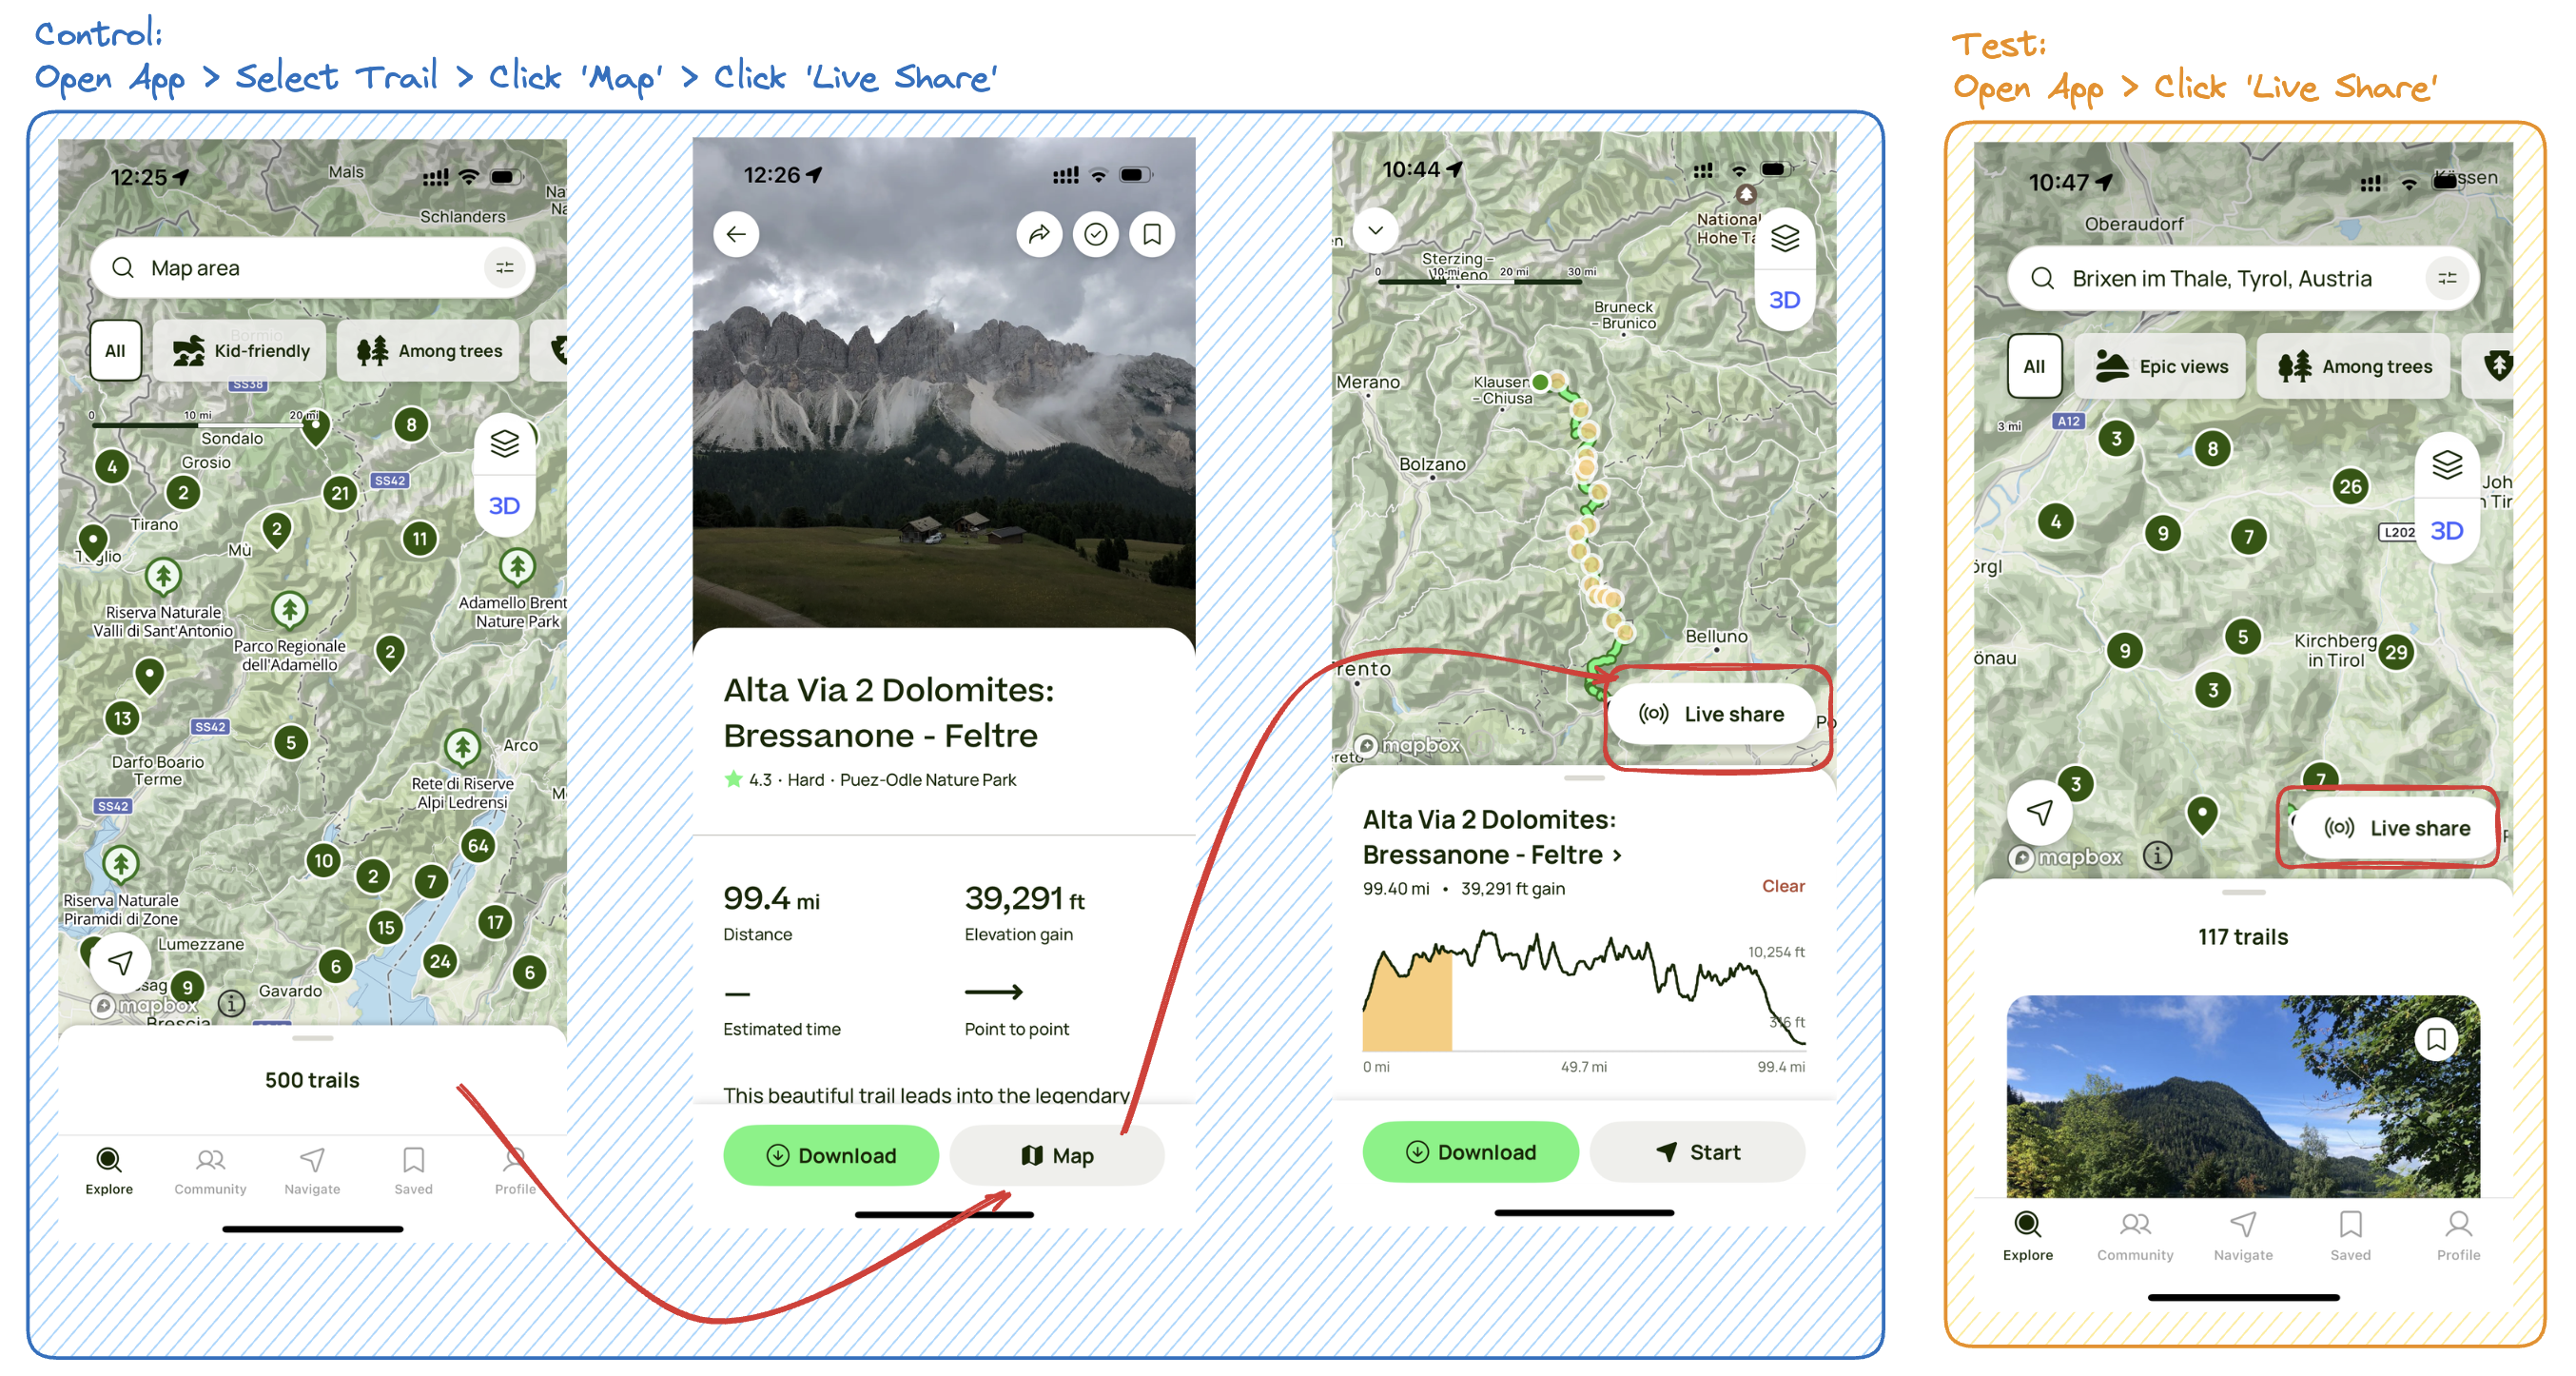
This mock A/B test examines the impact of relocating the “Live Share” feature to the home screen of a B2C product, modeled on a platform like AllTrails. The “Live Share” feature enables users to share their real-time location and activity with others during outdoor adventures, enhancing collaboration and safety.
The objective of this test is to determine whether making the “Live Share” feature more prominent on the home screen improves three key metrics: user engagement, retention, and conversion rates from free to premium subscriptions. The test is structured to run over a 3-month period, utilizing generated test data to simulate real-world conditions.
Relocating “Live Share” to the home screen is expected to:
Engagement Rate: The percentage of users who interact with “Live Share” during test period. Helps measures immediate effect of highlighting the feature on user engagement.
Retention Rate: The percentage of users who interact with the “Live Share” feature that have continued to use the feature. Helps measure the stickiness of the feature on long-term usage.
Conversion Rate: The percentage of users that interacted with the “Live Share” feature and upgraded to premium during test period. Helps assess the impact of the feature on monetization.
Moving the “Live Share” feature to the home screen significantly increased engagement and conversion rates. More users interacted with the feature, and a higher percentage upgraded to premium. Retention, measured as users returning to use the feature again, also improved but to a lesser extent.
The 5 free uses act as an effective trial, and making the feature more visible led free-tier users to hit the limit faster, driving premium conversions. This explains the strong gains in engagement and conversion rates.
However, the smaller increase in retention suggests the feature drives initial use and upgrades but is less effective at encouraging long-term, repeated use. Free-tier users hitting the usage cap may also limit retention unless they convert.
Implementing this change permanently would capitalize on the increased engagement and conversions. However, the modest improvements in feature reuse suggest further exploration of strategies to sustain long-term retention.
Goal: Understand factors influencing repeated use of the feature.
Approach: Analyze user groups based on their joining date and interactions with the feature. Evaluate patterns in session duration (
duration_minutes) and the number of people users share their activity with (shared_with_count) to identify what drives repeated feature usage.Potential Outcome: Users who share their location with more than three people may be more likely to reuse the feature. Hikers with longer sessions (e.g., over 90 minutes) may show higher repeat usage, suggesting that retention efforts could target long-duration users with tailored messaging or nudges.
Goal: Measure and reduce the time from sign-up to first interaction with the feature.
Approach: Track how long it takes new users to use the feature for the first time. Test different onboarding experiences or prompts to encourage earlier engagement.
Potential Outcome: If most users delay using the feature for more than two weeks, this could indicate the need for better education or visibility during onboarding. Early engagement (e.g., within the first week) may correlate with a higher likelihood of repeated use, suggesting a key time window for promoting the feature.
Goal: Encourage more frequent use of the feature.
Approach: Analyze the duration of use (
duration_minutes) and activity date (event_date) to understand when users drop off in their interactions with the feature.Potential Outcome: Users may be more likely to use the feature on weekends, so weekday reminders (e.g., “Plan your next hike now!”) could drive engagement during slower periods. Hikers who receive prompts tied to their location (e.g., near a popular trailhead) may engage more frequently with “Live Share.”
Goal: Understand behaviors that lead users to upgrade to premium.
Approach: Study user activity before upgrading, including how often they use “Live Share” and other app features (
feature,duration_minutes,event_date). Look for patterns, such as whether users who interact with social features like comments or reviews are more likely to subscribe.Potential Outcome: Premium conversion rates might be higher for users who interact with multiple app features (e.g., viewing reviews, commenting), indicating the importance of promoting complementary functionalities alongside “Live Share.”